English · EN-US
English Full Tutorial
English narration with burned-in captions, covering the complete AI strategy analysis and backtest refinement workflow.
One application, two cores: Taiwan single stocks and index futures each get their own strategy workspace and backtest data, and never affect each other.
Your settings and backtest evidence become a complete prompt; ChatGPT, Gemini or Claude return three candidate strategies you can fill straight back in. After backtesting they enter the strategy ranking, and the one you like imports with a single click. No coding, and every strategy has evidence behind it.
Available now on Windows; the mobile version (iOS / Android) is coming soon, with store listings rolling out on the Microsoft Store, Google Play and the App Store.
Full prompt → three candidate strategies → one-click import from the ranking
Learn more ↓ 02 EVIDENCE-DRIVEN OPTIMIZATIONThree months of second-level data and about a million backtest rows; the AI only proposes changes to existing parameters
Learn more → 03 ALL-SESSION AUTOMATED TRADINGPick a strategy, set contract size and risk controls, start with one click; stop or step in at any time
Learn more →Retrieving public health status...
The public browser reads a same-origin HTTPS health gateway. The gateway then verifies both HA web nodes without exposing search or database services.
Live comprehensive ranking of anonymous strategies across every server — top 50. The TAIEX futures ranking is above, filterable by the seven strategy categories; the Taiwan single-stock ranking is below, merging the futures-linked and stock-data rankings into one table with a Source column. Both share the data source of Subject Strategies → Strategy Backtest Ranking in the desktop app.
| Updated | Rank | Report | Category / 3-dimension recipe | Win rate | Net pts (mo) | Trades | Max DD | Est. monthly returnReturn |
|---|---|---|---|---|---|---|---|---|
| 09/11 | 1 | Event & sessionVADZ·Hourly + MAD·Mid-high freq + MACD·Hourly | Intraday | 57.14% | 3095.67 | 28 | 2837PF 2.46 | 88.45% | |
| 09/10 | 2 | Volatility & breakoutEWMA·Mid-high freq + RealizedVariance·Daily + VolumeDelta·Hourly | Swing | 70% | 2624.33 | 10 | 2600PF 4.03 | 74.98% | |
| 09/11 | 3 | Volume & liquidityVADZ·Mid-high freq + VolumeDelta·Hourly + VolumeMA·Mid-high freq | Intraday | 41.18% | 3421.67 | 187 | 3371PF 1.61 | 97.76% | |
| 09/10 | 4 | Composite & multi-TFEWMA·Mid-high freq + RealizedVariance·Daily + VolumeDelta·Hourly | Swing | 58.33% | 2414 | 12 | 2741PF 3.48 | 68.97% | |
| 09/11 | 5 | Composite & multi-TFEWMA·Mid-high freq + RealizedVariance·Daily + VolumeDelta·Hourly | Swing | 58.33% | 2178.67 | 12 | 3481PF 2.76 | 62.25% | |
| 09/11 | 6 | Composite & multi-TFEWMA·Mid-high freq + RealizedVariance·Daily + VolumeDelta·Hourly | Swing | 58.33% | 2146.33 | 12 | 3517PF 2.73 | 61.32% | |
| 09/11 | 7 | Event & sessionVADZ·Mid-high freq + VolumeDelta·Hourly + VolumeMA·Mid-high freq | Intraday | 49.35% | 2877 | 77 | 2305PF 1.96 | 82.2% | |
| 09/11 | 8 | Mean reversionEWMA·Mid-high freq + RealizedVariance·Daily + VolumeDelta·Hourly | Swing | 80% | 2056 | 10 | 2978PF 3.07 | 58.74% | |
| 09/10 | 9 | Composite & multi-TFVolumeDelta·Hourly + VADZ·Mid-high freq + BB·Hourly | Intraday | 66.67% | 1793.33 | 12 | 3536PF 2.15 | 51.24% | |
| 09/11 | 10 | Composite & multi-TFEWMA·Mid-high freq + RealizedVariance·Daily + VolumeDelta·Hourly | Swing | 72.73% | 2949.33 | 11 | 2297PF 4.52 | 84.27% | |
| 09/10 | 11 | Composite & multi-TFVolumeDelta·Hourly + VADZ·Mid-high freq + BB·Hourly | Intraday | 66.67% | 1751.33 | 12 | 3536PF 2.09 | 50.04% | |
| 09/10 | 12 | Composite & multi-TFRealizedVariance·Hourly + RSI·Hourly + VWAP·Mid-high freq | Intraday | 60% | 2301.33 | 10 | 1928PF 3.07 | 65.75% | |
| 09/10 | 13 | Composite & multi-TFRealizedVariance·Hourly + RSI·Hourly + VWAP·Mid-high freq | Intraday | 60% | 2311 | 10 | 1928PF 3.02 | 66.03% | |
| 09/10 | 14 | Event & sessionVWAP·Mid-high freq + BB·Hourly + MACD·Hourly | Intraday | 55.56% | 2153 | 18 | 2824PF 2.97 | 61.51% | |
| 09/10 | 15 | Volume & liquidityVolumeDelta·Hourly + VADZ·Mid-high freq + BB·Hourly | Intraday | 60% | 2275.33 | 10 | 1948PF 3.05 | 65.01% | |
| 09/10 | 16 | Composite & multi-TFEWMA·Mid-high freq + RealizedVariance·Daily + VolumeDelta·Hourly | Swing | 80% | 2761.33 | 10 | 1941PF 4.92 | 78.9% | |
| 09/10 | 17 | Mean reversionEWMA·Mid-high freq + RealizedVariance·Daily + VolumeDelta·Hourly | Swing | 58.33% | 1637.67 | 12 | 3146PF 2.17 | 46.79% | |
| 09/11 | 18 | Trend followingKD·Daily + MACD·Daily + PivotPoints·Hourly | Swing | 34.56% | 2123.33 | 327 | 4475PF 1.19 | 60.67% | |
| 09/10 | 19 | Composite & multi-TFVolumeDelta·Mid-high freq + ADX·Hourly + BB·Hourly | Intraday | 43.75% | 1575 | 16 | 4284PF 1.86 | 45% | |
| 09/10 | 20 | Composite & multi-TFRealizedVariance·Hourly + RSI·Hourly + VWAP·Mid-high freq | Intraday | 40% | 2154.33 | 15 | 2175PF 2.85 | 61.55% | |
| 09/10 | 21 | Composite & multi-TFRealizedVariance·Hourly + RSI·Hourly + VWAP·Mid-high freq | Intraday | 60% | 2175 | 10 | 1955PF 2.89 | 62.14% | |
| 09/10 | 22 | Composite & multi-TFEWMA·Mid-high freq + RealizedVariance·Daily + VolumeDelta·Hourly | Swing | 63.64% | 2527.67 | 11 | 2643PF 3.67 | 72.22% | |
| 09/11 | 23 | Trend followingKD·Daily + MACD·Daily + PivotPoints·Hourly | Swing | 33.84% | 2082 | 331 | 4466PF 1.18 | 59.49% | |
| 09/11 | 24 | Composite & multi-TFEWMA·Mid-high freq + RealizedVariance·Daily + VolumeDelta·Hourly | Swing | 77.78% | 2510 | 9 | 2309PF 4.26 | 71.71% | |
| 09/11 | 25 | Composite & multi-TFEWMA·Mid-high freq + RealizedVariance·Daily + VolumeDelta·Hourly | Swing | 70% | 1484 | 10 | 3321PF 2.34 | 42.4% | |
| 09/10 | 26 | Composite & multi-TFEWMA·Mid-high freq + RealizedVariance·Daily + VolumeDelta·Hourly | Swing | 63.64% | 2601 | 11 | 2374PF 4.03 | 74.31% | |
| 09/10 | 27 | Composite & multi-TFEWMA·Mid-high freq + RealizedVariance·Daily + VolumeDelta·Hourly | Swing | 63.64% | 2590.67 | 11 | 2405PF 3.98 | 74.02% | |
| 09/10 | 28 | Volatility & breakoutEWMA·Mid-high freq + RealizedVariance·Daily + VolumeDelta·Hourly | Swing | 63.64% | 2568 | 11 | 2464PF 3.88 | 73.37% | |
| 09/10 | 29 | Mean reversionEWMA·Mid-high freq + RealizedVariance·Daily + VolumeDelta·Hourly | Swing | 70% | 1549 | 10 | 3132PF 2.48 | 44.26% | |
| 09/10 | 30 | Composite & multi-TFEWMA·Mid-high freq + RealizedVariance·Daily + VolumeDelta·Hourly | Swing | 63.64% | 2272.67 | 11 | 3408PF 2.89 | 64.93% | |
| 09/11 | 31 | Volatility & breakoutEWMA·Mid-high freq + RealizedVariance·Daily + VolumeDelta·Hourly | Swing | 63.64% | 2266.33 | 11 | 3418PF 2.87 | 64.75% | |
| 09/11 | 32 | Event & sessionADX·Daily + EWMA·Mid-high freq + VolumeDelta·Hourly | Swing | 77.78% | 2234 | 9 | 3428PF 2.96 | 63.83% | |
| 09/10 | 33 | Volatility & breakoutEWMA·Mid-high freq + RealizedVariance·Daily + VolumeDelta·Hourly | Swing | 58.33% | 2589 | 12 | 2348PF 3.79 | 73.97% | |
| 09/11 | 34 | Composite & multi-TFEWMA·Mid-high freq + RealizedVariance·Daily + VolumeDelta·Hourly | Swing | 70% | 2484 | 10 | 2341PF 3.9 | 70.97% | |
| 09/10 | 35 | Composite & multi-TFEWMA·Mid-high freq + RealizedVariance·Daily + VolumeDelta·Hourly | Swing | 53.85% | 1962 | 13 | 2446PF 2.42 | 56.06% | |
| 09/10 | 36 | Mean reversionRealizedVariance·Hourly + RSI·Hourly + VWAP·Mid-high freq | Intraday | 75% | 2526 | 4 | 607PF 13.48 | 72.17% | |
| 09/11 | 37 | Mean reversionRealizedVariance·Hourly + RSI·Hourly + VWAP·Mid-high freq | Intraday | 50% | 2011 | 10 | 2261PF 2.68 | 57.46% | |
| 09/11 | 38 | Composite & multi-TFEWMA·Mid-high freq + RealizedVariance·Daily + VolumeDelta·Hourly | Swing | 63.64% | 2292.33 | 11 | 3133PF 3.06 | 65.5% | |
| 09/10 | 39 | Mean reversionRealizedVariance·Hourly + RSI·Hourly + VWAP·Mid-high freq | Intraday | 50% | 1991 | 10 | 2317PF 2.64 | 56.89% | |
| 09/11 | 40 | Composite & multi-TFEWMA·Mid-high freq + RealizedVariance·Daily + VolumeDelta·Hourly | Swing | 63.64% | 2260.33 | 11 | 3229PF 2.98 | 64.58% | |
| 09/10 | 41 | Composite & multi-TFEWMA·Mid-high freq + RealizedVariance·Daily + VolumeDelta·Hourly | Swing | 70% | 2581.33 | 10 | 2185PF 4.23 | 73.75% | |
| 09/11 | 42 | Composite & multi-TFEWMA·Mid-high freq + RealizedVariance·Daily + VolumeDelta·Hourly | Swing | 63.64% | 2230.33 | 11 | 3326PF 2.88 | 63.72% | |
| 09/10 | 43 | Composite & multi-TFEWMA·Mid-high freq + RealizedVariance·Daily + VolumeDelta·Hourly | Swing | 70% | 2453.33 | 10 | 2271PF 3.97 | 70.1% | |
| 09/10 | 44 | Mean reversionKD·Hourly + VADZ·Mid-high freq + VolumeDelta·Mid-high freq | Intraday | 46.88% | 2661 | 32 | 1876PF 2.59 | 76.03% | |
| 09/10 | 45 | Composite & multi-TFEWMA·Mid-high freq + RealizedVariance·Daily + VolumeDelta·Hourly | Swing | 53.85% | 2545.33 | 13 | 2362PF 3.62 | 72.72% | |
| 09/10 | 46 | Composite & multi-TFEWMA·Mid-high freq + RealizedVariance·Daily + VolumeDelta·Hourly | Swing | 63.64% | 2387 | 11 | 2755PF 3.42 | 68.2% | |
| 09/10 | 47 | Composite & multi-TFEWMA·Mid-high freq + RealizedVariance·Daily + VolumeDelta·Hourly | Swing | 53.85% | 2540.33 | 13 | 2364PF 3.6 | 72.58% | |
| 09/10 | 48 | Composite & multi-TFEWMA·Mid-high freq + RealizedVariance·Daily + VolumeDelta·Hourly | Swing | 60% | 1391 | 10 | 3406PF 2.13 | 39.74% | |
| 09/11 | 49 | Volatility & breakoutEWMA·Mid-high freq + RealizedVariance·Daily + VolumeDelta·Hourly | Swing | 63.64% | 2216.33 | 11 | 3312PF 2.88 | 63.32% | |
| 09/10 | 50 | Composite & multi-TFEWMA·Mid-high freq + RealizedVariance·Daily + VolumeDelta·Hourly | Swing | 63.64% | 2234.67 | 11 | 3225PF 2.95 | 63.85% |
This table mirrors the TAIEX futures comprehensive ranking under the app's Subject Strategies → Strategy Backtest Ranking, top 50 (switch across the seven strategy categories; points are TAIEX futures index points; estimated monthly return = monthly net points × NT$200 per point ÷ NT$700,000 capital). Taiwan single-stock rankings are a separate data set and never mix with this table. The full top 500, per-trade evidence, hourly statistics and one-click import are available in the desktop app. Past backtest results do not guarantee future profits.
| Updated | Rank | Report | Source | Category / 3-dimension recipe | Win rate | Trades | Max DD (%) | Avg monthly returnMonthly |
|---|---|---|---|---|---|---|---|---|
| 09/11 | 1 | Stock's own datastock-data branch | Reversal & rangeBB·Daily + KD·Daily + RSI·Daily | Swing | 52.63% | 19 | 8.05PF 1.39 | 2.51%39.3 holding days | |
| 09/11 | 2 | Stock's own datastock-data branch | Reversal & rangeBB·Daily + KD·Daily + RSI·Daily | Swing | 52.94% | 17 | 4.67PF 1.8 | 4.58%36.4 holding days | |
| 09/11 | 3 | Stock's own datastock-data branch | Volume & volatilityBB·Daily + MACD·Daily + RSI·Daily | Swing | 44.74% | 38 | 9.57PF 1.09 | 0.7%59.7 holding days | |
| 09/11 | 4 | Stock's own datastock-data branch | Volume & volatilityBB·Daily + MACD·Daily + RSI·Daily | Swing | 50% | 38 | 9.07PF 1.08 | 0.7%56.9 holding days | |
| 09/11 | 5 | Stock's own datastock-data branch | Volume & volatilityBB·Daily + MACD·Daily + RSI·Daily | Swing | 37.5% | 40 | 18.78PF 1.22 | — | |
| 09/11 | 6 | Stock's own datastock-data branch | Reversal & rangeBB·Daily + BB·Weekly + RSI·Daily | Swing | 40.54% | 37 | 18.1PF 1.08 | — | |
| 09/11 | 7 | Stock's own datastock-data branch | Reversal & rangeRSI·Daily + RSI·Weekly + KD·Daily | Swing | 50% | 12 | 7.1PF 1.72 | — | |
| 09/11 | 8 | Stock's own datastock-data branch | Volume & volatilityBB·Daily + MACD·Daily + RSI·Daily | Swing | 37.84% | 37 | 13.87PF 1.01 | — | |
| 09/11 | 9 | Stock's own datastock-data branch | Volume & volatilityBB·Daily + MACD·Daily + RSI·Daily | Swing | 36.84% | 38 | 18.78PF 1.07 | — | |
| 09/11 | 10 | Stock's own datastock-data branch | Reversal & rangeBB·Daily + BB·Weekly + RSI·Daily | Swing | 43.24% | 37 | 13.35PF 1.2 | — | |
| 09/11 | 11 | Stock's own datastock-data branch | Reversal & rangeBB·Daily + KD·Daily + RSI·Daily | Swing | 41.67% | 12 | 7.9PF 1.43 | — | |
| 09/11 | 12 | Stock's own datastock-data branch | Reversal & rangeRSI·Daily + RSI·Weekly + KD·Daily | Swing | 45.45% | 11 | 7.82PF 1.58 | — | |
| 09/11 | 13 | Stock's own datastock-data branch | Reversal & rangeRSI·Daily + RSI·Weekly + KD·Daily | Swing | 40% | 10 | 7.82PF 1.45 | — | |
| 09/11 | 14 | Stock's own datastock-data branch | Reversal & rangeRSI·Daily + RSI·Weekly + KD·Daily | Swing | 50% | 10 | 7.1PF 1.83 | — | |
| 09/11 | 15 | Stock's own datastock-data branch | Reversal & rangeRSI·Daily + RSI·Weekly + KD·Daily | Swing | 45.45% | 11 | 7.1PF 1.59 | — | |
| 09/11 | 16 | Stock's own datastock-data branch | Reversal & rangeBB·Daily + BB·Weekly + RSI·Daily | Swing | 44.74% | 38 | 13.35PF 1.32 | — | |
| 09/11 | 17 | Stock's own datastock-data branch | Volume & volatilityBB·Daily + MACD·Daily + RSI·Daily | Swing | 38.1% | 42 | 17.41PF 1.17 | — | |
| 09/11 | 18 | Stock's own datastock-data branch | Volume & volatilityBB·Daily + MACD·Daily + RSI·Daily | Swing | 39.47% | 38 | 13.87PF 1.16 | — | |
| 09/11 | 19 | Stock's own datastock-data branch | Volume & volatilityBB·Daily + MACD·Daily + RSI·Daily | Swing | 39.47% | 38 | 13.87PF 1.12 | — | |
| 09/11 | 20 | Stock's own datastock-data branch | Reversal & rangeBB·Daily + KD·Daily + RSI·Daily | Swing | 36.36% | 11 | 8.4PF 1.37 | — | |
| 09/11 | 21 | Stock's own datastock-data branch | Volume & volatilityBB·Daily + MACD·Daily + RSI·Daily | Swing | 41.03% | 39 | 13.87PF 1.27 | — | |
| 09/11 | 22 | Stock's own datastock-data branch | Reversal & rangeBB·Daily + MACD·Daily + RSI·Daily | Swing | 41.03% | 39 | 12.49PF 1.17 | — | |
| 09/11 | 23 | Stock's own datastock-data branch | Trend continuationBB·Daily + MACD·Daily + RSI·Daily | Swing | 50% | 2 | 0.44PF 8.11 | 67.52%0.9 holding days | |
| 09/11 | 24 | Stock's own datastock-data branch | Reversal & rangeBB·Daily + MACD·Daily + RSI·Daily | Swing | 50% | 38 | 6.9PF 1.13 | 1.04%60.5 holding days | |
| 09/11 | 25 | Stock's own datastock-data branch | Reversal & rangeBB·Daily + BB·Weekly + RSI·Daily | Swing | 41.03% | 39 | 16.73PF 1.03 | — | |
| 09/11 | 26 | Stock's own datastock-data branch | Volume & volatilityBB·Daily + MACD·Daily + RSI·Daily | Swing | 36.59% | 41 | 18.78PF 1.14 | — | |
| 09/11 | 27 | Stock's own datastock-data branch | Reversal & rangeBB·Daily + MACD·Daily + RSI·Daily | Swing | 40% | 40 | 17.41PF 1.08 | — | |
| 09/11 | 28 | Stock's own datastock-data branch | Reversal & rangeBB·Daily + MACD·Daily + RSI·Daily | Swing | 37.5% | 40 | 17.41PF 1.03 | — | |
| 09/11 | 29 | Stock's own datastock-data branch | Reversal & rangeRSI·Daily + RSI·Weekly + KD·Daily | Swing | 44.44% | 9 | 7.1PF 1.67 | — | |
| 09/11 | 30 | Stock's own datastock-data branch | Reversal & rangeBB·Daily + KD·Daily + RSI·Daily | Swing | 100% | 2 | 0PF 999 | 12.7%5.2 holding days | |
| 09/11 | 31 | Stock's own datastock-data branch | Reversal & rangeBB·Daily + KD·Daily + RSI·Daily | Swing | 66.67% | 9 | 2.32PF 1.61 | 4.72%10.2 holding days | |
| 09/11 | 32 | Stock's own datastock-data branch | Reversal & rangeBB·Daily + KD·Daily + RSI·Daily | Swing | 75% | 8 | 2.32PF 2.48 | 7.47%10.1 holding days | |
| 09/11 | 33 | Stock's own datastock-data branch | Reversal & rangeBB·Daily + KD·Daily + RSI·Daily | Swing | 62.5% | 8 | 2.52PF 1.55 | 4.21%10.2 holding days | |
| 09/11 | 34 | Stock's own datastock-data branch | Reversal & rangeBB·Daily + BB·Weekly + RSI·Daily | Swing | 46.15% | 39 | 11.98PF 1.36 | — | |
| 09/11 | 35 | Stock's own datastock-data branch | Reversal & rangeBB·Daily + MACD·Daily + RSI·Daily | Swing | 42.5% | 40 | 12.49PF 1.31 | — | |
| 09/11 | 36 | Stock's own datastock-data branch | Reversal & rangeBB·Daily + KD·Daily + RSI·Daily | Swing | 27.27% | 11 | 10.75PF 1.16 | — | |
| 09/11 | 37 | Stock's own datastock-data branch | Trend continuationBB·Daily + MACD·Daily + RSI·Daily | Swing | 100% | 2 | 0PF 999 | — | |
| 09/11 | 38 | Stock's own datastock-data branch | Reversal & rangeBB·Daily + BB·Weekly + RSI·Daily | Swing | 100% | 2 | 0PF 999 | — | |
| 09/11 | 39 | Stock's own datastock-data branch | Reversal & rangeBB·Daily + KD·Daily + RSI·Daily | Swing | 71.43% | 7 | 2.32PF 2.37 | 6.96%10.1 holding days | |
| 09/11 | 40 | Futures-linkedcorrelation branch | Reversal & rangeEWMA·Mid-high freq + RealizedVariance·Daily + VolumeDelta·Hourly | Swing | 50% | 2 | 0.16PF 3.26 | — | |
| 09/11 | 41 | Stock's own datastock-data branch | Reversal & rangeBB·Daily + KD·Daily + RSI·Daily | Swing | 22.22% | 9 | 10.04PF 1.12 | — | |
| 09/11 | 42 | Stock's own datastock-data branch | Reversal & rangeBB·Daily + KD·Daily + RSI·Daily | Swing | 25% | 12 | 11.65PF 1.07 | — | |
| 09/11 | 43 | Stock's own datastock-data branch | Reversal & rangeBB·Daily + KD·Daily + RSI·Daily | Swing | 63.64% | 11 | 2.32PF 1.05 | 0.42%9.9 holding days | |
| 09/11 | 44 | Futures-linkedcorrelation branch | Reversal & rangeEWMA·Hourly + VolumeDelta·Hourly + RealizedVariance·Hourly | Intraday | 66.67% | 3 | 0.27PF 2.75 | — | |
| 09/11 | 45 | Stock's own datastock-data branch | Reversal & rangeBB·Daily + KD·Daily + RSI·Daily | Swing | 30% | 10 | 9.54PF 1.17 | — | |
| 09/11 | 46 | Stock's own datastock-data branch | Reversal & rangeBB·Daily + KD·Daily + RSI·Daily | Swing | 27.27% | 11 | 10.76PF 1.03 | — | |
| 09/11 | 47 | Futures-linkedcorrelation branch | Reversal & rangeEWMA·Mid-high freq + RealizedVariance·Daily + VolumeDelta·Hourly | Swing | 50% | 4 | 0.94PF 1.06 | — | |
| 09/11 | 48 | Stock's own datastock-data branch | Trend continuationBB·Daily + MACD·Daily + RSI·Daily | Swing | 50% | 2 | 0.77PF 16.67 | — | |
| 09/11 | 49 | Stock's own datastock-data branch | Trend continuationBB·Daily + MACD·Daily + RSI·Daily | Swing | 66.67% | 3 | 3.06PF 4.71 | — | |
| 09/11 | 50 | Stock's own datastock-data branch | Reversal & rangeBB·Daily + KD·Daily + RSI·Daily | Swing | 60% | 10 | 9.81PF 1.03 | 0.39%18.8 holding days |
This table merges the two Taiwan-stock rankings inside the app (futures-linked = correlation branch, stock's own data = stock-data branch) into one comprehensive top 50, with a Source column telling them apart. Taiwan stocks have no index points: every figure is a percentage return — (exit − entry) ÷ entry per stock, net of the 0.435% round trip (0.1425% commission × 2 + 0.15% transaction tax), then averaged across stocks; the win rate is computed per stock and then averaged, and max drawdown is a percentage too. The rightmost column is a monthly return: the cumulative return divided by the strategy's total holding trading days, times 20 (a month holds about twenty trading days). Taiwan-stock cycles run from hours to days, so holding time is converted into trading days to give every trade one common unit; only hours actually held inside the 09:00-13:30 session count (divided by 4.5), flat time is excluded, and the figure is printed beneath each return. An em dash means that strategy's backtest is being regenerated and will appear when it finishes. Only net-profitable strategies with at least 2 trades are listed. Full rankings, per-trade evidence and one-click import are in the desktop app. Past backtest results do not guarantee future profits.
Separate workspaces, revisions and backtests. Trade only futures, only single stocks, or both
Taiwan single stocks and index futures are two separate workspaces with separate data; strategies, revisions and backtests never affect each other.
Correlation strength between each stock and the index future is computed on a 5-minute grid, so high-correlation names are identified from data, not intuition.
Once a futures strategy locks a trigger, the selected stocks enter and exit according to same/inverse direction, evenly split capital and highest-correlation-first rules.
Replayed over the 09:00-13:30 Taiwan trading session; win rate, net profit, PF and max drawdown use exactly the same definitions as the futures side.
The futures-linked and stock-data rankings merged into one table of percentage returns net of fees and transaction tax, with the same one-click import into a custom subject slot.
Securities and futures use separate broker connection layers; stock orders travel the securities channel and never mix with futures orders.
A live view of the demo machine (simulation mode, demo account), broadcast one way: watch only, with no way to control that machine. The view refreshes once a second, about 1-2 seconds behind real time.
Ten custom strategies, five core setting areas plus three first-entry gates, revision history, individual backtests, AI prompts, and simulated trading
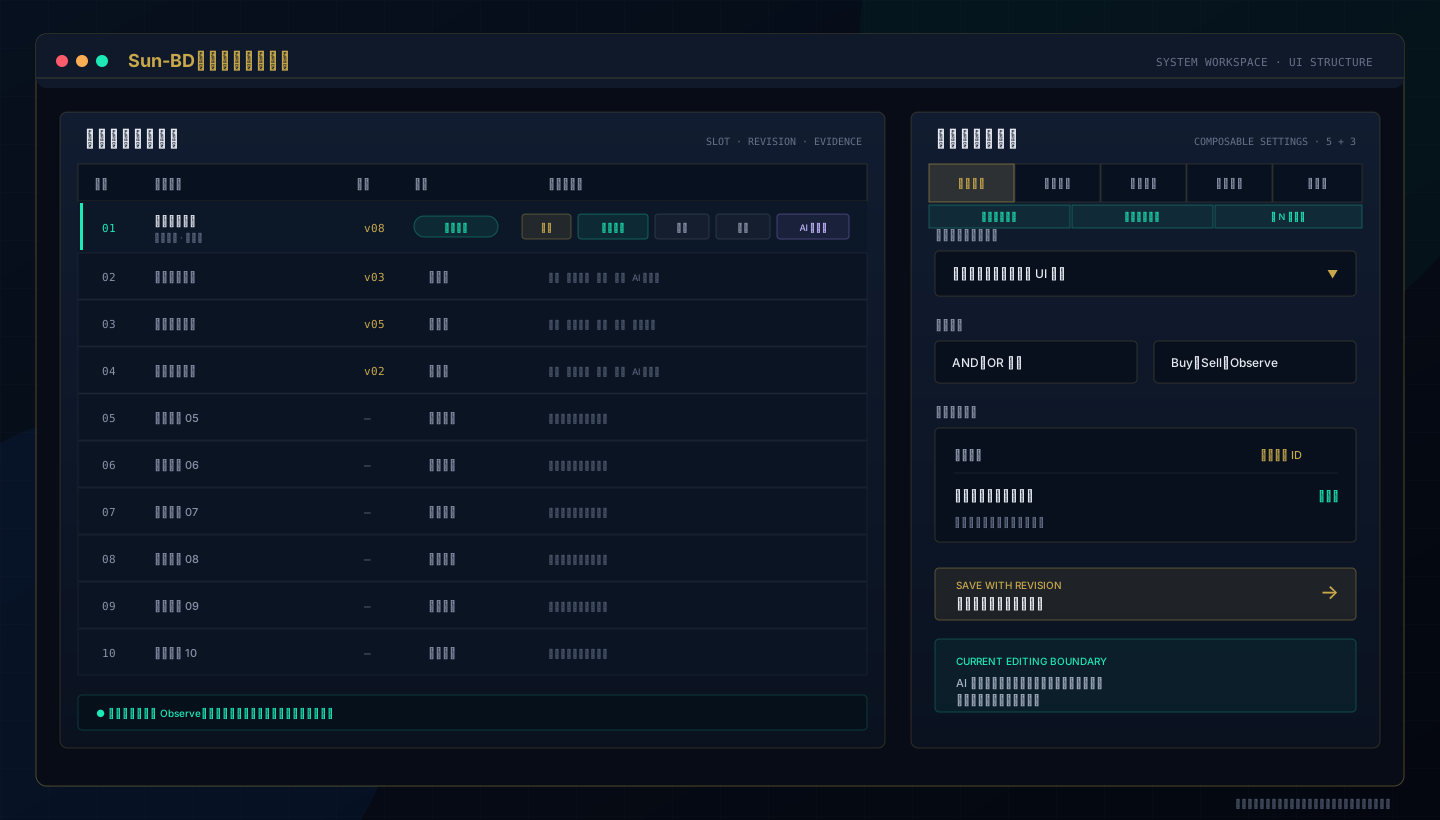
Sun-BD Windows — Named Strategies · Revisions · Individual Backtests · Diffs · Reports · AI Prompts
Watch the complete SUN-BD Stock Market AI Strategy Analysis System TAIEX-futures core workflow (a Taiwan single-stock tutorial will follow). Follow login and the six operating areas, then learn AI multidimensional strategy analysis, four-dimensional backtests, ranked-strategy imports, individual backtests, and iterative refinement.
English narration with burned-in captions, covering the complete AI strategy analysis and backtest refinement workflow.
繁體中文旁白與畫面內字幕,完整示範 AI 策略分析及回測優化工作流程。
The videos are for product training and research. Historical backtests do not guarantee future performance. Before live trading, verify the broker API and recheck the market, order size, risk controls, and every parameter.
From market phase detection to risk management — comprehensive quantitative decision support
Automatically identify six structural phases: Accumulation → Early Rally → Main Rally → Overheated → Distribution → Decline.
Integrates 12+ technical indicators with cross-period validation to present structured entry and exit references.
Compose five core setting areas across ten named slots, then gate a flat-position first entry by trend state, market phase, and the Nth independent trigger before saving and testing each revision.
Generate complete TXT prompts for three UI-ready candidate sets, then analyze the current revision’s latest trade-level backtest evidence.
After configuration, observe entry, scaling, stops, targets, closing, and transaction records without sending a live broker order.
Enterprise-grade cloud computing with low-latency connections, dedicated resources, 24/7 stable operation.
From product overview to strategy engines — master the full Sun-BD architecture
Multi-period quantitative structure engine — why market phase recognition is the core of trading.
→ FeaturesComplete entry logic, risk management, and position control capabilities.
→ Custom StrategyTen named slots, five core setting areas plus three first-entry gates, saved revisions, individual backtests, reports, and simulation.
→ Technical ValuesUnderstand the trend, price, volume, and volatility families—and how multi-period values enter a custom strategy and its evidence loop.
→ AI Strategy ToolsOne dedicated page for both complete-prompt workflows, the refinement loop, system imagery, and operating flow.
→Download the Windows desktop version now; the mobile version (iOS / Android) is coming soon — see the download page for store listings and overseas direct downloads